Extreme Events – Figure 5.1b:
Illustrative efficient portfolio analysis: (b) Composition of corresponding
efficient portfolios
[this page | pdf | references | back links]
SmartChart version:
Not available (although please note that there is a
Nematrian web service function that does create such a plot, i.e. MnPlotQuadraticEfficientPortfolios and also an example spreadsheet that can be used to
do so, see here)
Variant used in book:
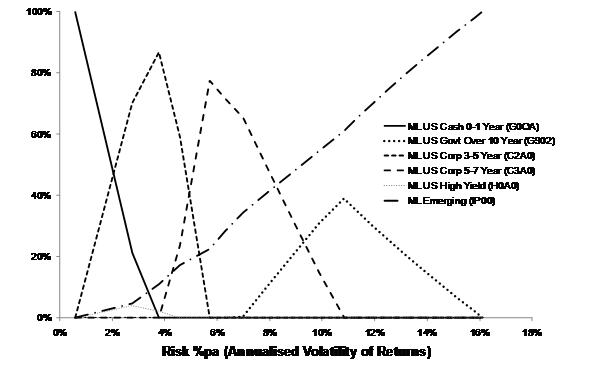
Source: Nematrian, Merrill Lynch, Bloomberg. Copyright
(c) Nematrian (2010)
NAVIGATION LINKS
Contents | Prev | Next | Chapter 5