Extreme Events – Figure 4.3:
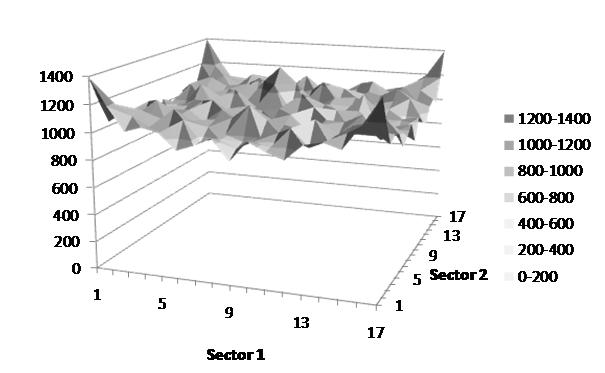
Fractile-fractile plot of blended PCA/ICA component rankings of sector relative
returns showing number of observations in each fractile pairing, averaged
across all principal component pairings and all +/- combinations of such pairs
[this page | pdf | references | back links]
SmartChart version:
Not available
Variant used in book:
Source: Nematrian, Thomson Datastream. Copyright (c)
Nematrian (2010)
NAVIGATION LINKS
Contents | Prev | Next | Chapter 4