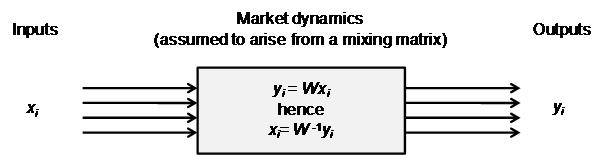
Extreme Events – Figure 4.2: Schematic
illustration of the impact of market dynamics
[this page | pdf | references | back links]
SmartChart version:
Not available
Variant used in book:
Source: Nematrian. Copyright (c) Nematrian (2010)
NAVIGATION LINKS
Contents | Prev | Next | Chapter 4