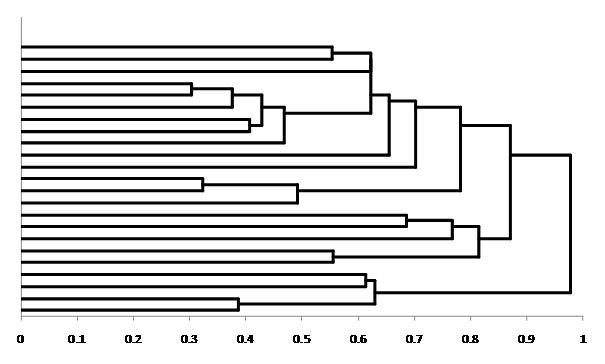
Extreme Events – Figure 3.22:
Illustrative cluster analysis of the sector relative return series used in
Figure 3.12. The distance along the x-axis corresponds to the average
‘distance’ between the individual elements of the cluster.
[this page | pdf | references | back links]
SmartChart version:
Source: Nematrian, Thomson Datastream. Copyright (c)
Nematrian (2010)
Variant used in book:
Source: Nematrian, Thomson Datastream. Copyright (c)
Nematrian (2010)
NAVIGATION LINKS
Contents | Prev | Next | Chapter 3