Extreme Events – Figure 3.20: A
one-dimensional ‘upwards’ QQ-plot
[this page | pdf | references | back links]
SmartChart version:
Not available (although please note that there is a Nematrian
web service function that does create such a plot, i.e. MnPlotStandardisedUpwards1dQQ)
Variant used in book:
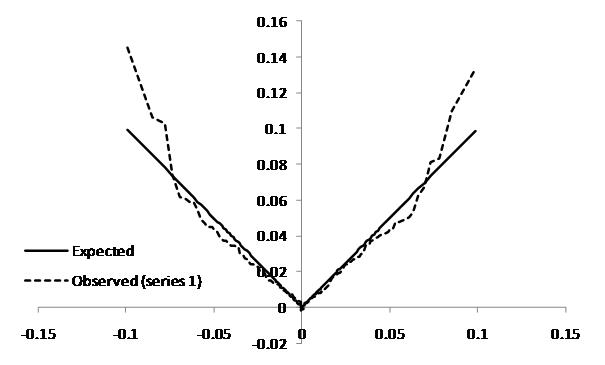
Source: Nematrian, Thomson Datastream. Copyright (c)
Nematrian (2010)
NAVIGATION LINKS
Contents | Prev | Next | Chapter 3