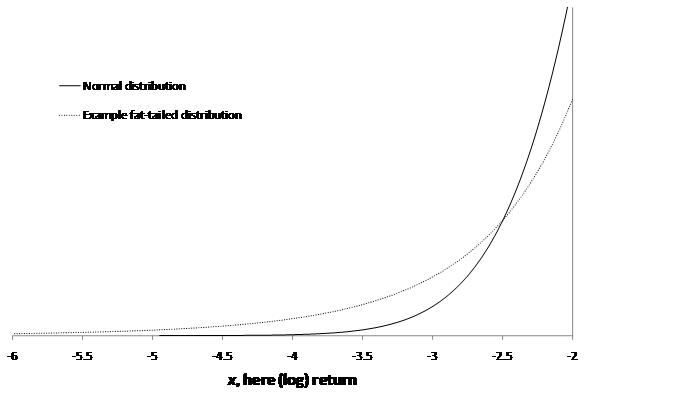
Extreme Events – Figure 2.3: Illustrative
probability density function plot as per Figure 2.2, but zooming in on just the
part of the lower tail of the distribution between x = -6 and x = -2
[this page | pdf | references | back links]
SmartChart version:
Source: Nematrian. Copyright (c) Nematrian (2010)
Variant used in book:
Source: Nematrian. Copyright (c) Nematrian (2010)
NAVIGATION LINKS
Contents | Prev | Next | Chapter 2