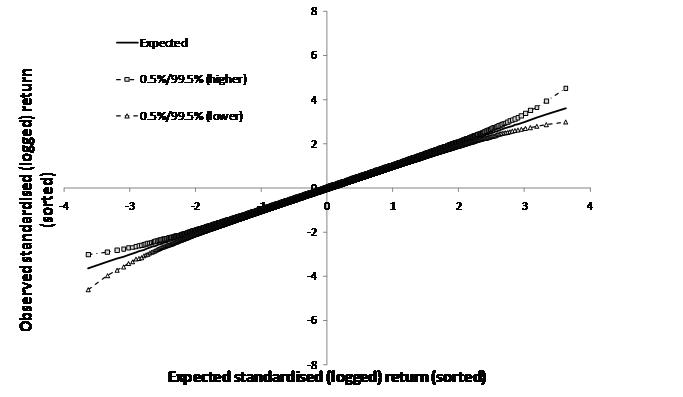
Extreme Events – Figure 2.15: Envelopes
of QQ-plots (at the 0.5% and 99.5% percentiles) of 1,000 Monte Carlo
simulations of daily return data with samples drawn from a normal distribution
[this page | pdf | references | back links]
SmartChart version:
Variant used in book:
Source: Nematrian. Copyright (c) Nematrian (2010)
NAVIGATION LINKS
Contents | Prev | Next | Chapter 2