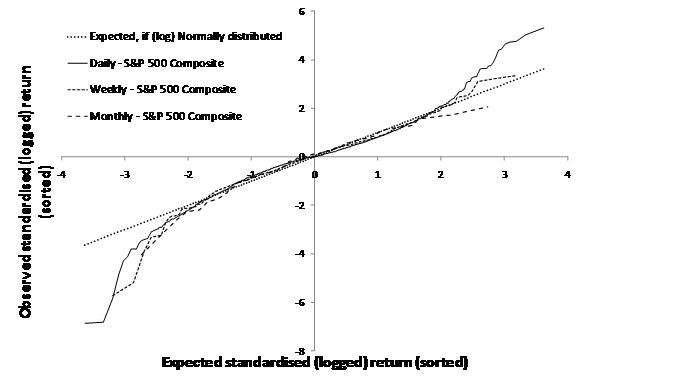
Extreme Events – Figure 2.11: QQ-plots of
daily, weekly and monthly returns on S&P 500 Composite index from end June
1994 to end December 2007
[this page | pdf | references | back links]
SmartChart version:
Source: Nematrian, Thomson Datastream. Copyright (c)
Nematrian (2010)
Variant used in book:
Source: Nematrian, Thomson Datastream. Copyright (c)
Nematrian (2010)
NAVIGATION LINKS
Contents | Prev | Next | Chapter 2