An analytical/semi-analytical analysis of
the characteristics of the Expected Worst Loss in T realisations for Normal
random variables
[this page | pdf | back links]
Suppose we have  which are
independent identically distributed Normal random variables, i.e.
which are
independent identically distributed Normal random variables, i.e.  . The worst loss in
  realisations
is
realisations
is 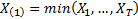 .
.
What, in such circumstances is the expected worst loss (in realisations)?
Without much loss of generality, we can focus on  , i.e. unit Normal
random variables, as
, i.e. unit Normal
random variables, as 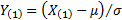 .
.
If  then all of the
  must also satisfy
  . As the are independent and
identically distribution, this means that:
. As the are independent and
identically distribution, this means that:

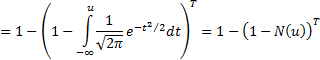
where  is the cumulative
distribution function of the unit Normal distribution.
is the cumulative
distribution function of the unit Normal distribution.
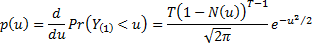
So the probability density function of  is
is  where:
The expected value of , i.e. the expected
worst loss in realisations for a
unit Normal distribution, is then 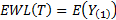 , i.e.:
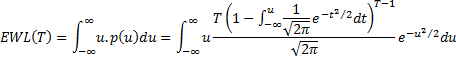
Using a symbolic algebra engine we find that there are
analytical formulae  for =
1, 2 or 3 but not thereafter:
for =
1, 2 or 3 but not thereafter:
As increases becomes more
negative, but only relatively slowly:
|
|
|
|
|
1
|
0
|
|
|
2
|
-0.5641895835
|
-0.5641895835
|
|
4
|
-1.029375373
|
-0.4651857895
|
|
8
|
-1.423600306
|
-0.394224933
|
|
16
|
-1.765991393
|
-0.342391087
|
|
32
|
-2.069668828
|
-0.303677435
|
|
64
|
-2.343733465
|
-0.274064637
|
|
128
|
-2.594597369
|
-0.250863904
|
|
256
|
-2.826863279
|
-0.232265910
|
We may check that the values shown above are reasonable
using a simulation approach, e.g. using VBA code in Microsoft Excel as per VBA code
that can be used to check this analysis.
The worst loss can also be thought of as a specific quantile
of a sample of Normal random variables. It might be viewed as the  ’th quantile (i.e.
half way between 0 and
’th quantile (i.e.
half way between 0 and  , given that the
sample has observations) . We
might therefore expect its expected value to be similar to the corresponding
quantile point of the Normal distribution. However, the Normal probability
density function is not normally approximately flat at the relevant quantile
point (and is instead upward sloping), so the Expected Worst Loss in T
realisations is normally somewhat above the ’th Normal quantile
point:
, given that the
sample has observations) . We
might therefore expect its expected value to be similar to the corresponding
quantile point of the Normal distribution. However, the Normal probability
density function is not normally approximately flat at the relevant quantile
point (and is instead upward sloping), so the Expected Worst Loss in T
realisations is normally somewhat above the ’th Normal quantile
point:
|
|
|
c.f. 
|
|
1
|
0
|
0
|
|
2
|
-0.5641895835
|
-0.67449
|
|
4
|
-1.029375373
|
-1.15035
|
|
8
|
-1.423600306
|
-1.53412
|
|
16
|
-1.765991393
|
-1.86273
|
|
32
|
-2.069668828
|
-2.15387
|
|
64
|
-2.343733465
|
-2.41756
|
|
128
|
-2.594597369
|
-2.66007
|
|
256
|
-2.826863279
|
-2.88563
|