Showing that the Mean Excess Function of
a Generalised
Pareto Distribution is linear in the exceedance threshold (for a specific
range of values of the distribution’s shape parameter)
[this page | pdf | back links]
If a random variable,  ,
is distributed according to a generalised Pareto distribution,
,
is distributed according to a generalised Pareto distribution,  ,
then it has the following probability density function (for
,
then it has the following probability density function (for  ):
):
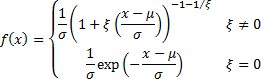
If  then
its domain is
then
its domain is  .
.
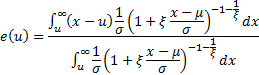
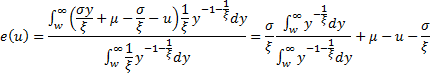
The mean excess function of a probability distribution is
defined as:

If  then
then mean excess function for this distribution is as follows (for
then
then mean excess function for this distribution is as follows (for  ):
):
Let 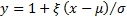 so
so
 and
and
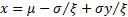 .
Let
.
Let 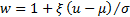 .
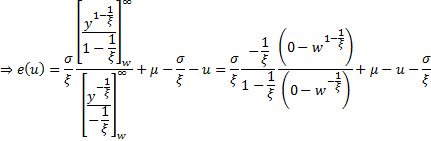
Then:
.
Then:

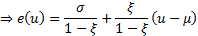
This is linear in  as
desired. A consequence is that we can test visually whether a data set appears
to be coming from a GPD by plotting the empirical mean excess function and
seeing if it appears to be linear (and we can also estimate
as
desired. A consequence is that we can test visually whether a data set appears
to be coming from a GPD by plotting the empirical mean excess function and
seeing if it appears to be linear (and we can also estimate  from
its slope if it is linear).
from
its slope if it is linear).