Extreme Events – Specimen Question
A.2.1(e) – Answer/Hints
[this page | pdf | references | back links]
Return
to Question
Q. What other methodologies
could you use to formulate a view about how fat-tailed this return series might
be if your focus was principally on fat-tailed behaviour around or below the
lower 10th percentile quantile level?
With a sample size of 20 there are only two data points in
the sample around or below the lower 10th percentile quantile level. This is
too few to permit any meaningful statistical analysis to be carried out in this
instance.
However, if the sample size were much larger, then we could
carry out the following:
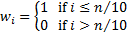
(a) We could define
a weighting ‘schema’, i.e.  , to
apply to the ordered data series,
, to
apply to the ordered data series,  . In this
case the form of the question might lead us to use:
. In this
case the form of the question might lead us to use:
(b) We could calculate the
normal distribution that best fitted the observed data sample, but giving
weight to the
observations, i.e. here only taking into account data where  . To do so
we would use functions as set out in the Nematrian web page on Weighted
Moments and Cumulants.
. To do so
we would use functions as set out in the Nematrian web page on Weighted
Moments and Cumulants.
(c) We could now
compare the ordered observed data versus that ‘expected’ were the normal
distribution in (ii) to have applied, perhaps visually and/or perhaps fitting
suitable curves through this comparison, e.g. a variant of the approach
underling the Nematrian’s standard weighted
cubic curve fit.
Formal tests for non-normality could then be carried out
using suitable refinements to standard test methodologies, see TestsForNormality.
NAVIGATION LINKS
Contents | Prev | Next | Question