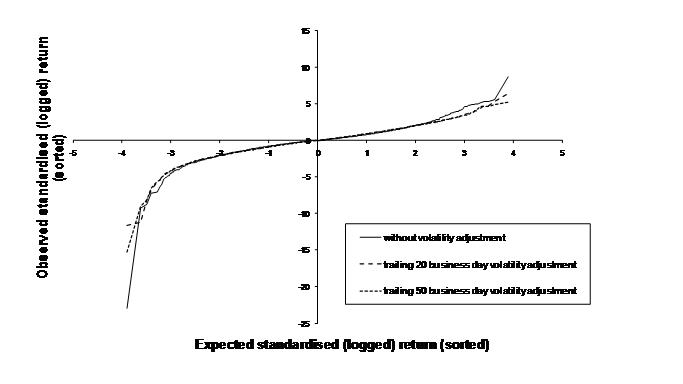
Extreme Events – Figure 2.21: QQ-plot of
S&P 500 daily price movements from early 1968 to 24 March 2009
[this page | pdf | references | back links]
SmartChart version:
Variant used in book:
Source: Nematrian, Thomson Datastream. Copyright (c)
Nematrian (2010)
NAVIGATION LINKS
Contents | Prev | Next | Chapter 2